The Model Flywheel: TBM Part 6
IT is the engine that needs to turn for our business to be successful, and in so many ways, we're the flywheel at the center of our products and services.

In part six of this series, we're going to take a look at AOL's IT Financial model. We began this journey over two years ago, and now it has become part of our monthly financial package we provide to each business lead. When creating our IT financial model at AOL, I broke the process into three major phases:
Modeling
This took us a solid year to work through numerous iterations and complete enough of the model that we were comfortable showing the results. While we constantly evaluate the rules in the model, the majority of our rules definition is now static from month to month. Likely we'll never fully lock the model and continue iterations as we go.
Evangelism
During this phase, which took us more than 6 months, we met with every single GM and product stake holder to explain the model. We showed the metrics we collected, how each data point was used in the rules that define our service catalog, and used real numbers to showcase that particular business unit's data. Correctly managing this phase allows you to begin shifting the dialog away from the black box, cost centric view of IT, and discuss IT's value.
Impact
In this final phase, which we now consider ourselves in, we will analyze, discover, and make better business decisions because we have data that we simply didn't have prior. The first round of these impacts will be the low hanging fruit; a realization that you need to update data retention policies, or applications are relying on expensive hardware devices for session management, or utilization of compute resources means you are overspending on server inventory. In this phase it is important to celebrate and message the benefits that the model is driving.

This is a picture of my office window, facing into the hallway. Attached to the outside glass is a child's toy, a Hot Wheels race track. The top spiral, in orange, spins and sends a car down the rest of the track. This is a symbol, in many ways, of what IT delivers for the company. I call this the IT Flywheel. We're the engine that needs to turn for our business to be successful, and in so many ways, we're the flywheel at the center of our products and services. This is also true of our financial model. Every day I see this as a reminder of the importance of the job we do and how critical we are to the rest of the company.

Here is a conceptual drawing of our financial model. Notice this also has a flywheel. On the left side of the diagram, we have the inputs to our model: usage metrics, asset data, and our logical grouping of what a product is. These three data points all live in our configuration management database (CMDB), and this is the starting point of our model. These three inputs map to our service catalog and are the units of consumption we use to define the rules of our model.
The fourth input comes from our financial team, under the corporate CFO, and provides financial data that wouldn't be appropriate to find in a CMDB, like salary and benefit costs or depreciation schedules. Before we created our IT financial model there were arbitrary allocation rules that were in place. Something like 40% of this services goes to Product A and 60% goes to product B. While it likely made a ton of sense when these rules were created, they were not influenced by changes in consumption and, over time, the rules did not properly reflect our business. Remember Goal #5 is "Be 100% Data Driven". We needed to replace all of these arbitrary rules with real-world consumption metrics.
You'll notice that there is a box labeled "Consumption by 2nd level" where data from our rules and service catalog flow into. AOL's business is grouped into three segments:
- Advertising, called AOL Platforms
- Web properties, called AOL Brands and
- Subscription, called AOL Membership
We realized that if we provided our monthly reporting at a high level, the data would not be specific enough to each product and service to make the best decisions. To solve this, we grouped the consumption of our services (from the service catalog) into a more fine grained definition. This is what we mean by "2nd level". Now we know exactly what services MapQuest, or our consumer email product, or our real time bidding advertising service consumes, and therefore what it costs to operate.
Starting with the very first invoice, we review the output with our business units, compare the delta from month to month, looking for expected trends, and use the dialog this generates to challenge the rules of our model. When we find something that needs adjusting, we feed this back into our rules definition, iterating until we feel comfortable we have realistically captured the true metrics and cost. In essence, this is our IT financial model flywheel.
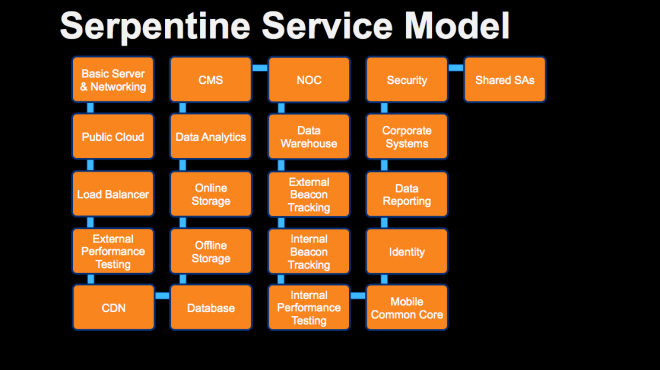
Above is our service catalog, depicted in what we like to refer to as our serpentine model. Costs flow from the upper left service, "basic server" down and to the right, following the blue line. This represents, in its entirety, the services we provide to the company and maps one-to-one to the invoice each GM receives from us at month end. This flow of costs prevents us from having any circular references in our model. Your service catalog should differ, of course, and the key takeaway is that you need to define your catalog and map your costs to each service you provide.

Finally, here is a sample output from our model. The financial figures are all illustrative and do not represent any actually product or service. You'll note that each line on our invoice maps directly to each box in our serpentine model. Since the color of money often matters, we've chosen to show both operational expenses (shown as OIBDA) and capital expenses (shown as non-OIBDA) broken out . We also elected to show the delta for each service from the previous month.
Now that we’ve built our model, educated our stakeholders about the report we produce, and are taking actions based on the data, we've learned a few tips to pass along. I'll share those next week, in the seventh segment of this series.